Ship Detection - Part 2 (Handling Outliers)
Dealing with huge images
Previously we looked at the data wrangling part of the competition where we converted the data annotations to darknet format. In this section, we will explore how we handled very large images. Our approach was to find the image outliers and split them into smaller images.
The problem
Some of the images in the dataset are very large. Some were bigger than 25000x25000 pixels. We could have scaled down the images to a smaller size, but this would have meant that smaller ships would not have been visible.
Finding outliers
To find the image size without loading the complete image, we will use imagesize library.
!pip install -q imagesizeimport os
import numpy as np
import matplotlib.pyplot as plt
import pandas as pd
from PIL import Image
from torchvision.io import read_image
import imagesizeDATASET_LOC = "./ship-detection"train_loc = f"{DATASET_LOC}/train"
val_loc = f"{DATASET_LOC}/val"
test_loc = f"{DATASET_LOC}/test"def get_width_height(directory):
widths, heights = [], []
files = os.listdir(directory)
for f in files:
width, height = imagesize.get(os.path.join(directory, f))
widths.append(width)
heights.append(height)
return np.array(widths), np.array(heights)train_widths, train_heights = get_width_height(f"{train_loc}/images")plt.scatter(train_widths, train_heights)
plt.show()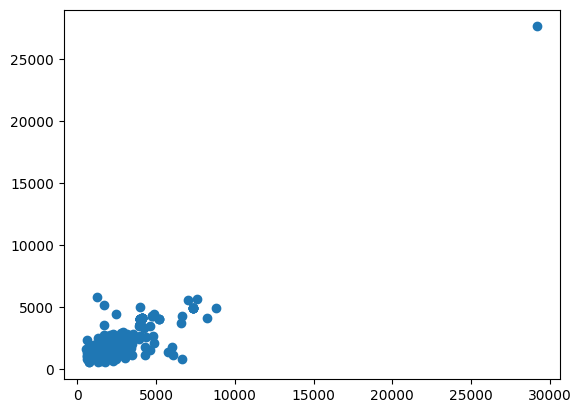
val_widths, val_heights = get_width_height(f"{val_loc}/images")plt.scatter(val_widths, val_heights)
plt.show()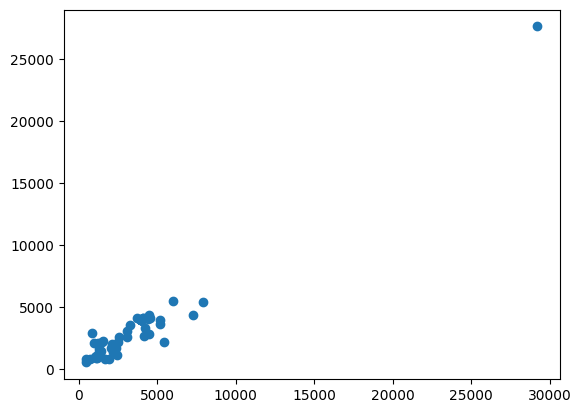
test_widths, test_heights = get_width_height(f"{test_loc}")plt.scatter(test_widths, test_heights)
plt.show()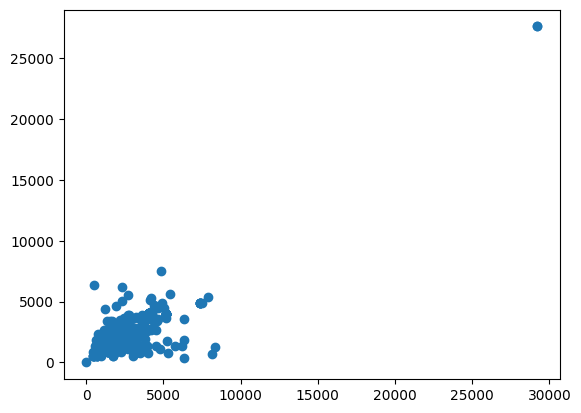
As we can see, most of there are huge images (>25000 width and/or height). We will split them later. But for now, we can modify our get_width_height function and get outliers
def get_outliers(directory):
    outliers = []
    files = os.listdir(directory)
    for f in files:
        width, height = imagesize.get(os.path.join(directory, f))
        if width > 25000 or height > 25000:
            outliers.append(os.path.join(directory, f))
    return outliers
train_outliers = get_outliers(f"{train_loc}/images")
val_outliers = get_outliers(f"{val_loc}/images")
test_outliers = get_outliers(f"{test_loc}")print(train_outliers)
print(val_outliers)
print(test_outliers)['./ship-detection/train/images/133.png']
['./ship-detection/val/images/15.png']
['./ship-detection/test/265.png', './ship-detection/test/305.png']Out of these outliers, train and val images need special attention. Not only do we need to split the images but we also need to split their annotations as well. So, let’s load their annotations
Loading Annotations
# Reading annotations
annot_file = f"{train_loc}/metadata.jsonl"
annotations = pd.read_json(path_or_buf=annot_file, lines=True)
annotations.head()| file_name | objects | |
|---|---|---|
| 0 | 0.png | {'bbox': [[6690, 3599, 7164, 3850], [6772, 338... |
| 1 | 1.png | {'bbox': [[613, 18, 619, 31], [668, 33, 681, 3... |
| 2 | 2.png | {'bbox': [[161, 489, 192, 506], [171, 630, 209... |
| 3 | 3.png | {'bbox': [[1889, 1463, 2283, 1526], [3953, 184... |
| 4 | 4.png | {'bbox': [[747, 2772, 769, 2787], [1007, 2040,... |
Now we need to split the images. You can find the code in this repository (add repository)
import importlib, split_image
importlib.reload(split_image)

from split_image import *
We split the images according to a stride. Let’s visualize how it looks in different patches
stride = 10000image = read_image(train_outliers[0])
image.shapetorch.Size([3, 27620, 29200])patches = get_patches(image, stride)fig, ax = plt.subplots(len(patches), len(patches[0]), figsize=(16, 16))
for i in range(len(patches)): # going width wise
for j in range(len(patches[i])): # going height wise
ax[j, i].set_title(f"Patch {i}, {j}")
ax[j, i].axis("off")
ax[j, i].imshow(patches[i][j])
plt.tight_layout()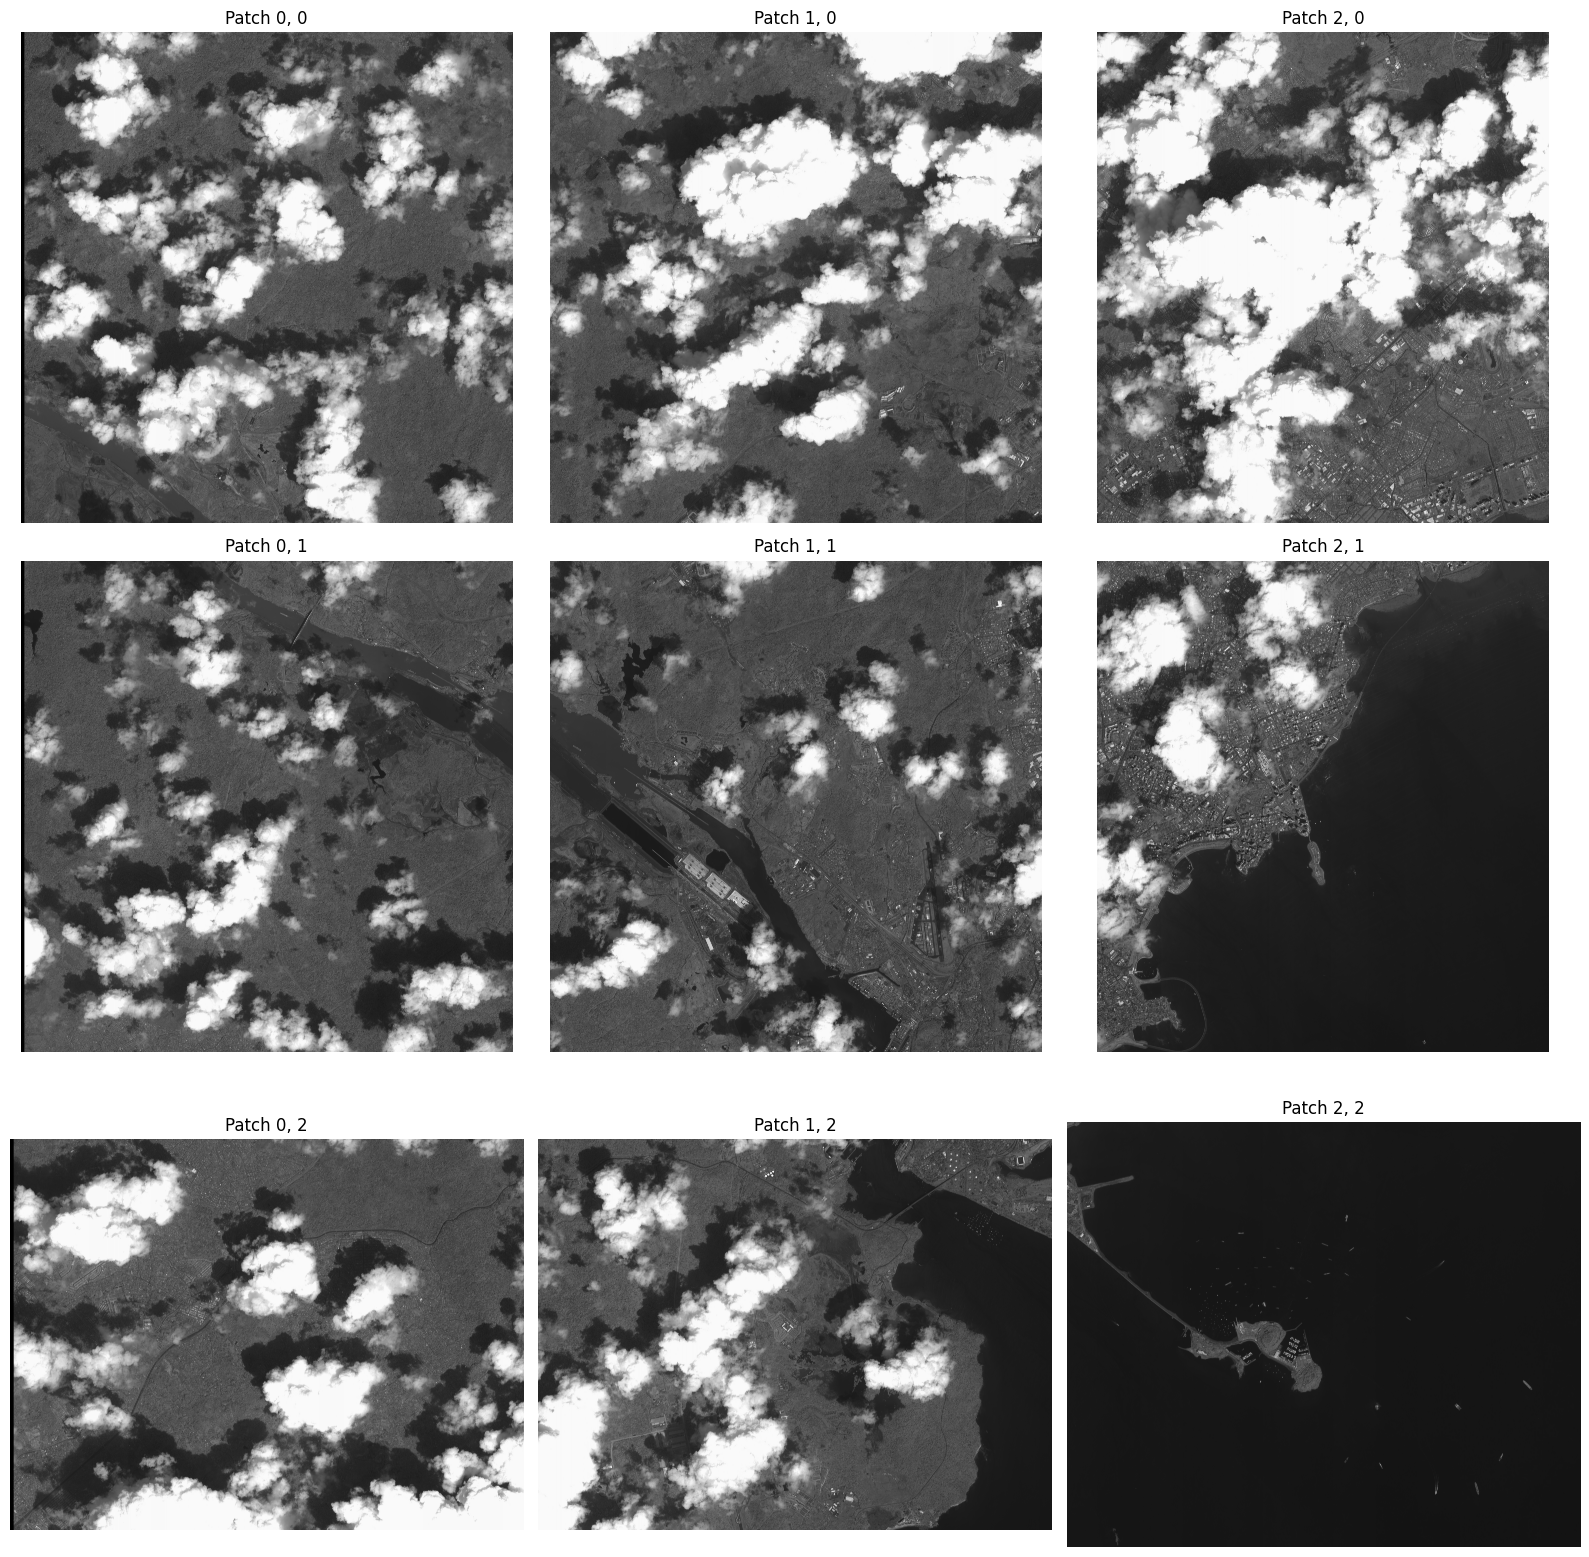
We can use get_all_relative_annots function to get annotations
matrix_size = (len(patches[0]), len(patches))
file = train_outliers[0].split("/")[-1].split(".")[0]
bbox = read_annotation(file, annotations)
rel_annots = get_all_relative_annots(bbox, matrix_size, stride)
fig, ax = plt.subplots(len(patches), len(patches[0]), figsize=(16, 16))
for i in range(len(patches)): # going width wise
for j in range(len(patches[i])): # going height wise
ax[j, i].set_title(f"Patch {i}, {j}")
ax[j, i].axis("off")
if rel_annots[i][j]:
lbl_img = get_labeled_image(patches[i][j], torch.tensor(rel_annots[i][j]))
ax[j, i].imshow(lbl_img.permute(1, 2, 0))
else:
ax[j, i].imshow(patches[i][j])
plt.tight_layout()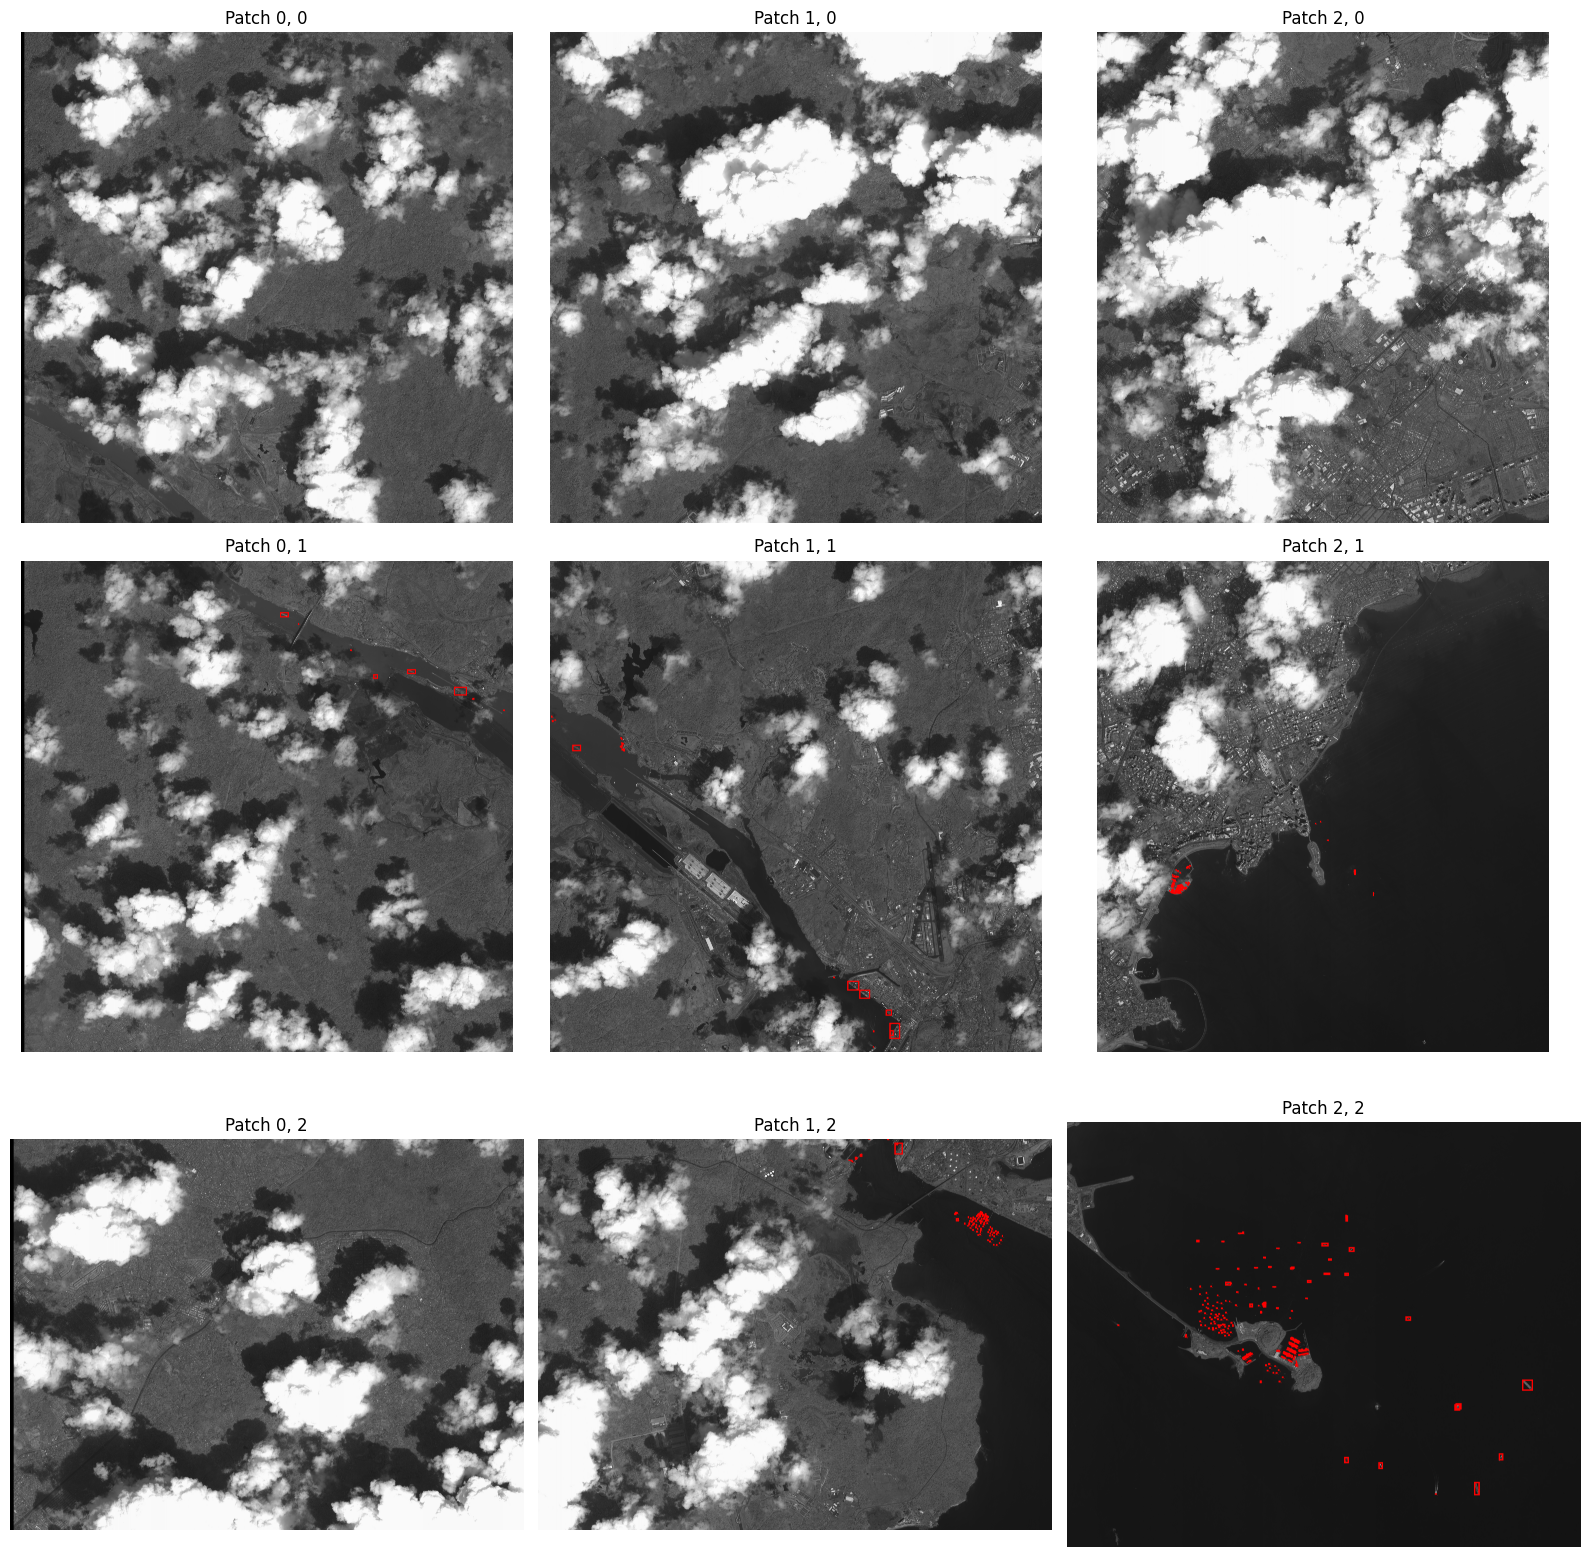
Some boats may lie in between two patches, we are ignoring them as they are very less in number.
Splitting the outliers
for t in train_outliers:
    split_image_annotations(t, annotations, stride)
for v in val_outliers:
split_image_annotations(v, annotations, stride)for test_image in test_outliers:
split_test_image(test_image, stride)Now we will move these in an outliers folder
!mkdir ship-detection/outliersoutliers = train_outliers + val_outliers + test_outliers
outliersfor src in outliers:
file = src.split('/')[-1]
dest = f"{DATASET_LOC}/outliers/{file}"
shutil.move(src, dest)Now we move the annotations for validation and training data
outliers = train_outliers + val_outliers
outliers
for outlier in outliers:
file = outlier.split('/')[-1].split(".")[0]
loc = "/".join(outlier.split("/")[:-2])
src = f"{loc}/labels/{file}.txt"
dest = f"{DATASET_LOC}/outliers/{file}.txt"
shutil.move(src, dest)Perfect, now we can move on to training the model in the next part.
|Next Part: Training the model